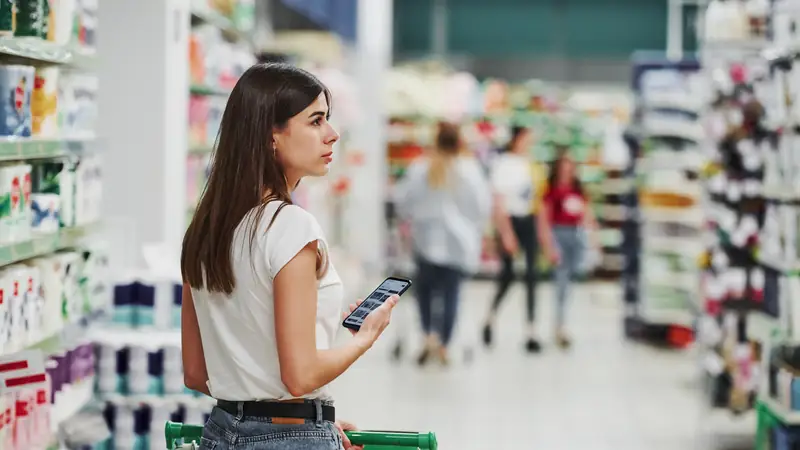
Your store, measured — entrance to checkout
Entrance footfall, zone heatmaps and checkout queue time — measured by the same small devices that measure your screens. Anonymous, on the device, never recorded. Real-time alerts for the store, comparable data for the chain.
Three things every store wants to know
How many came in, and when.
Entrance counting by hour and day, entries and exits, store-to-store comparison. Staffing follows real traffic, not last year's assumption.

Where they went.
Zone counts and dwell time from one or more cameras — a heatmap of the store that shows which areas work and which are passed by.

How long they queued.
A camera aligned with the checkout measures waiting time and congestion — the one number shoppers remember.
Queue time at the checkout
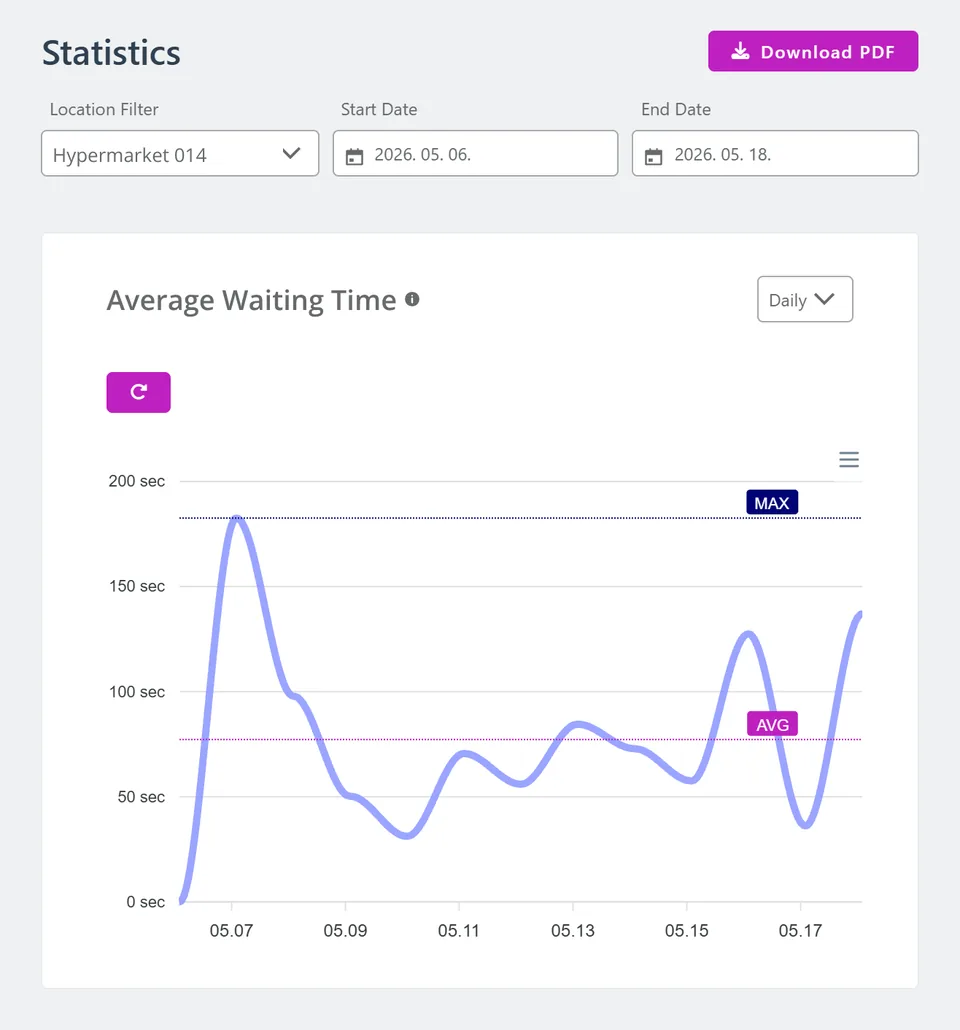
A camera aligned with the checkout zone measures how long shoppers wait and how the queue builds up through the day. The store gets a live congestion signal to open a till; the chain gets waiting time per store and hour — a service-level KPI measured, not surveyed. No face is detected for this: the measurement is a count of people in a zone over time.
Entrance footfall and zone heatmaps
A camera at the entrance counts entries and exits by hour. Add cameras inside and the store becomes a set of zones: how many shoppers reach the back of the store, how long they spend at a promotion, which aisle is passed by. Results are counts and seconds per zone — never a path of an individual. Compare stores, compare layouts, and see what a change did.
Alerts for the store, data for the chain
On the shop floor, now.
A queue alert when waiting time passes a threshold, so a till can be opened before the line grows. Delivered to staff by e-mail today; other channels — a message or a webhook into your own tools — can be built into your deployment.
Queue alert
Store · checkout zone · waiting time · time
At the centre, over time.
Footfall, zone and queue history per store and hour; store-to-store and layout comparison; CSV export, API, dashboard.
The shelf has its own page
The same device family also watches the shelf: every position reported as full, running low or empty, with a restock alert the moment a position empties.
Built for how stores actually work
Its own connection
Each device runs on its own 4G link. It does not touch your store network — no access, no exposure, nothing for IT to approve.
Plug and play
Devices arrive pre-installed and ready to run. On site you need a power socket and a place for the camera; placement is agreed during the pilot.
Minimal hardware
A small mini PC and a USB camera, or an existing RTSP camera stream. Linux, Windows or Android — it runs on entry-level Android signage players as well.
One device family
The same device family measures the screen, the store and the shelf — a retail media network can be extended with store analytics or shelf monitoring, and the other way round.
Retail media →Built by a software company, adapted to your store
The shelf monitor and the checkout-queue timer were not on a feature list. A customer asked, and a team that has written enterprise software for 25 years built them into the product. That is how RVC.DIGITAL works: a product, adapted to your store — your zones, your thresholds, your alert channels, your reports, or a measurement nobody offers yet. Tell us what you need to measure.
Shoppers and staff are counted, never identified
In use in retail chains
Hypermarket chains run RVC.DIGITAL in their stores, measuring the audience of their in-store screens with the same device family described on this page.
Shelf availability monitoring is live in a Hungarian hypermarket.
Shelf availability →Start with a pilot, not a contract
A pilot runs in one to five stores for two to four weeks: an entrance, a checkout zone, or both. We agree the cameras and zones with you, install pre-configured devices, and close with a report — footfall by hour, queue time, zone comparison. You decide what comes next.
Store heatmaps are delivered as individually scoped projects, priced per deployment — the pilot is where we define the scope together.